Educational Effectiveness
The information provided below is in cooperation with our accrediting agency, the Association of Theological Schools (ATS). Questions? Feel free to reach out to the admissions office about the quality of a Calvin Seminary degree.
Placement Information Organized By Year
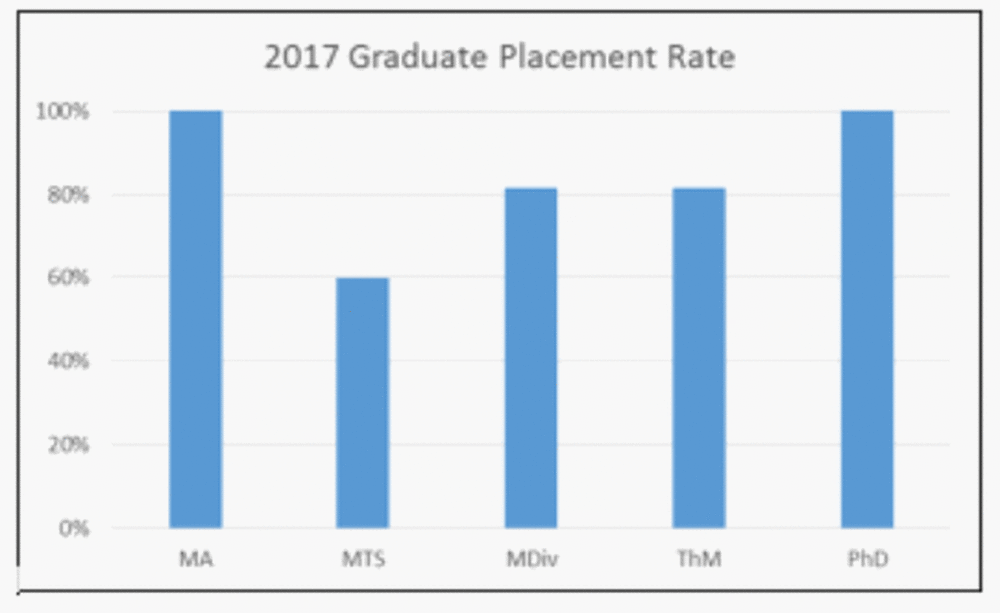
2017 Graduates
| Program | % Placed* | Placed** | No Response | Total Graduates |
|---|---|---|---|---|
| MA | 100% | 7 | 0 | 7 |
| MTS | 60% | 3 | 0 | 5 |
| MDiv | 81% | 22 | 1 | 27 |
| ThM | 81% | 22 | 0 | 27 |
| PhD | 100% | 2 | 0 | 2 |
* Reported as of November 2018
** "Placed" means in a position appropriate to the person’s vocational intentions, which could be work or further study. Non-vocational placements are not shown.
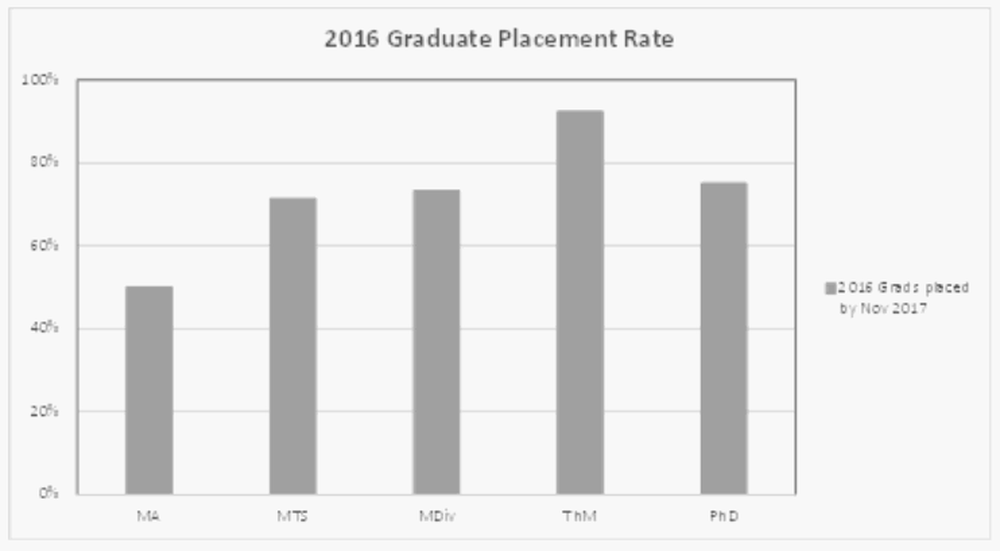
2016 Graduates
| Program | % Placed* | Placed** | No Response | Total Graduates |
|---|---|---|---|---|
| MA | 50% | 4 | 1 | 8 |
| MTS | 71% | 5 | 0 | 7 |
| MDiv | 73% | 22 | 2 | 30 |
| ThM | 92% | 24 | 2 | 26 |
| PhD | 75% | 3 | 0 | 4 |
* Reported as of November 2017
** "Placed" means in a position appropriate to the person’s vocational intentions, which could be work or further study. Non-vocational placements are not shown.
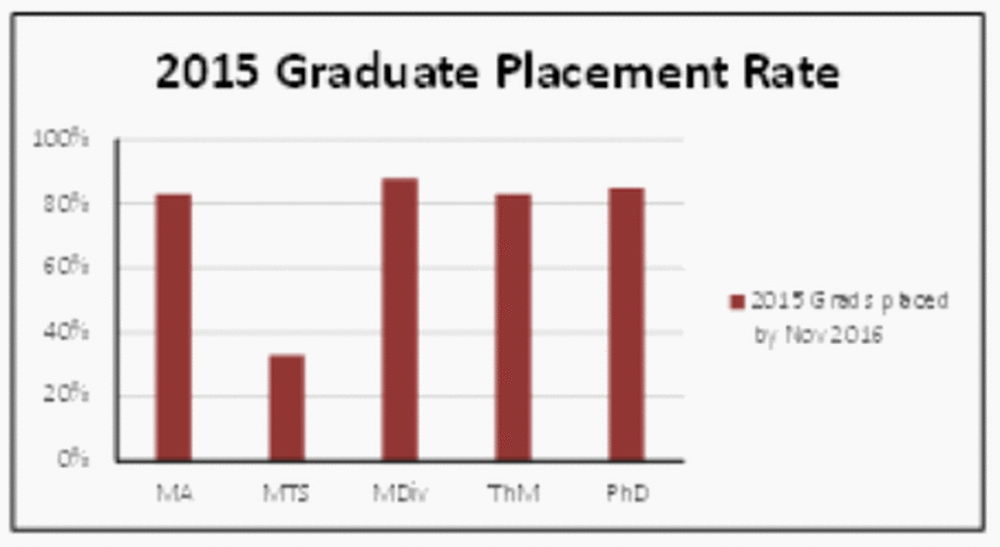
2015 Graduates
| Program | % Placed* | Placed** | No Response | Total Graduates |
|---|---|---|---|---|
| MA | 83% | 5 | 0 | 6 |
| MTS | 33% | 2 | 1 | 6 |
| MDiv | 88% | 24 | 2 | 27 |
| ThM | 83% | 20 | 4 | 24 |
| PhD | 85% | 6 | 1 | 7 |
* Reported as of November 2016
** "Placed" means in a position appropriate to the person’s vocational intentions, which could be work or further study. Non-vocational placements are not shown.
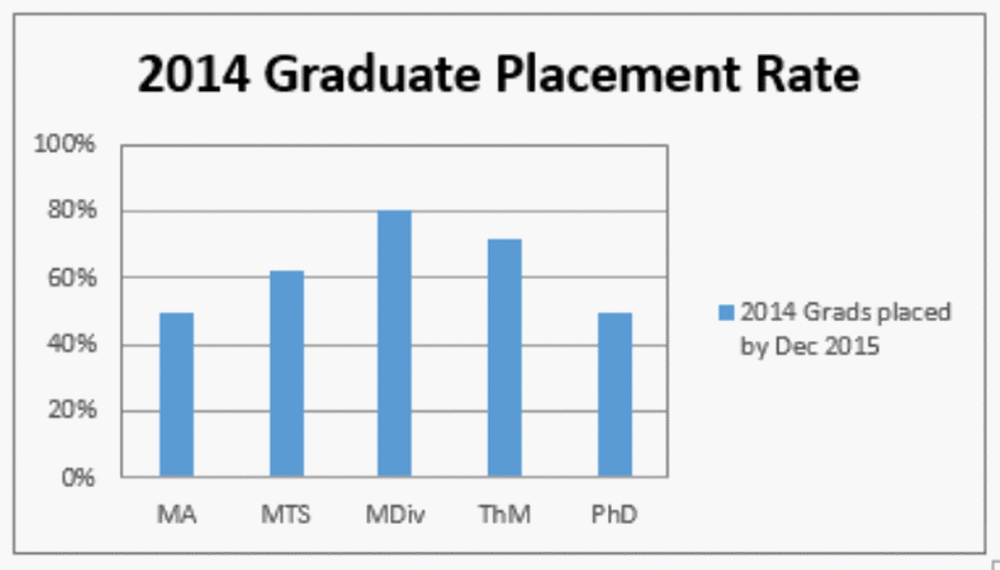
2014 Graduates
| Program | % Placed* | Placed** | No Responses | Total Graudates |
|---|---|---|---|---|
| MA | 50% | 3 | 2 | 6 |
| MTS | 63% | 5 | 3 | 8 |
| MDiv | 84% | 21 | 3 | 25 |
| ThM | 71% | 25 | 9 | 35 |
| PhD | 50% | 1 | 0 | 2 |
* Reported as of November 2015
** "Placed" means in a position appropriate to the person’s vocational intentions, which could be work or further study. Non-vocational placements are not shown.
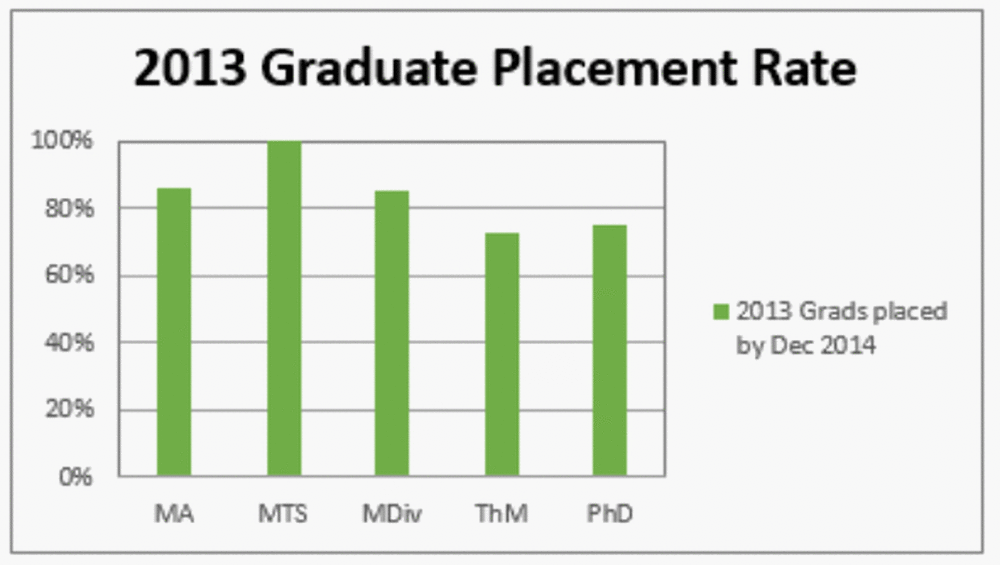
2013 Graduates
| Program | % Placed* | Placed** | No Responses | Total Graduates |
|---|---|---|---|---|
| MA | 86 | 6 | 1 | 7 |
| MTS | 100 | 2 | 0 | 2 |
| MDiv | 85 | 28 | 0 | 33 |
| ThM | 72 | 21 | 8 | 29 |
| PhD | 75 | 3 | 0 | 4 |
* Reported as of November 2014
** "Placed" means in a position appropriate to the person’s vocational intentions, which could be work or further study. Non-vocational placements are not shown.
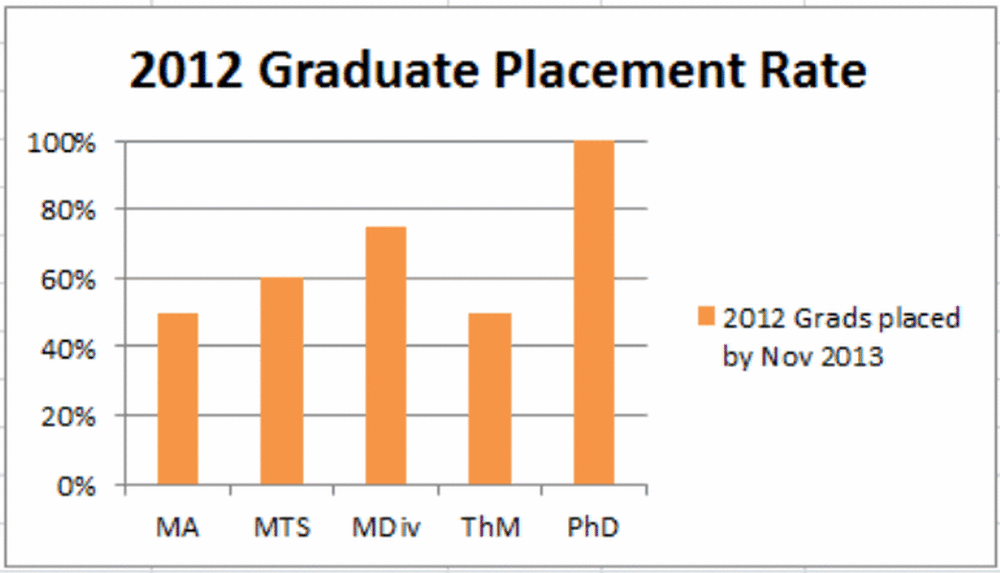
2012 Graduates
| Program | % Placed* | Placed** | No Responses | Total Graduates |
|---|---|---|---|---|
| MA | 50% | 8 | 4 | 16 |
| MTS | 60% | 3 | 2 | 5 |
| MDiv | 75% | 21 | 3 | 28 |
| ThM | 50% | 12 | 10 | 24 |
| PhD | 100% | 6 | 0T | 6 |
* Reported as of November 2013
** "Placed" means in a position appropriate to the person’s vocational intentions, which could be work or further study. Non-vocational placements are not shown.
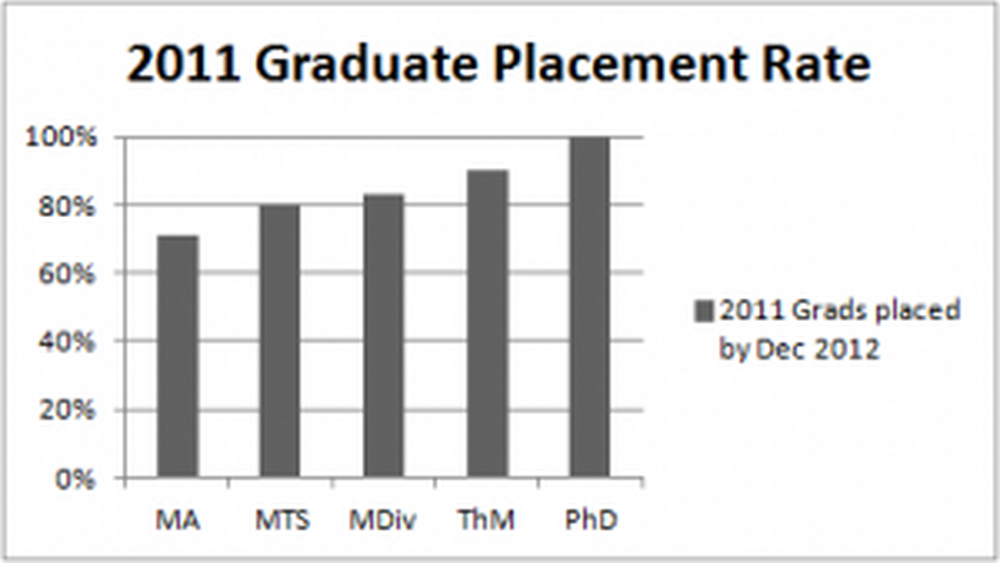
2011 Graduates
| Program | % Placed* | Placed** | No Responses | Total Graduates |
|---|---|---|---|---|
| MA | 71% | 10 | 4 | 14 |
| MTS | 80% | 4 | 0 | 5 |
| MDiv | 83% | 25 | 4 | 30 |
| ThM | 90% | 19 | 2 | 21 |
| PhD | 100% | 6 | 0 | 6 |
* Reported as of November 2012
** "Placed" means in a position appropriate to the person’s vocational intentions, which could be work or further study. Non-vocational placements are not shown.
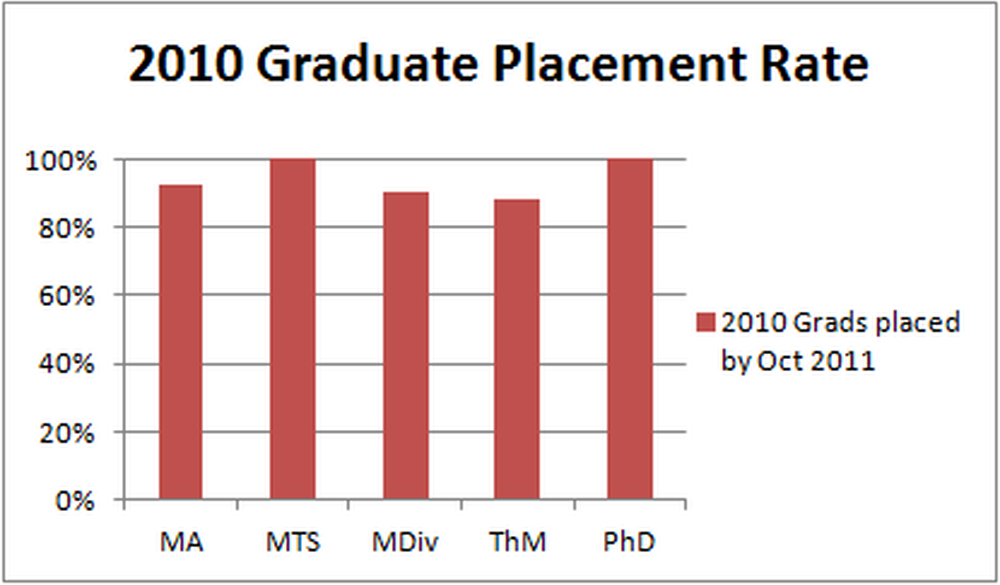
2010 Graduates
| Program | % Placed* | Placed** | No Responses | Total Graduates |
|---|---|---|---|---|
| MA | 93% | 13 | 1 | 14 |
| MTS | 100% | 4 | 0 | 4 |
| MDiv | 90% | 28 | 3 | 31 |
| ThM | 88% | 15 | 2 | 17 |
| PhD | 100% | 3 | 0 | 3 |
* Reported as of November 2011
** "Placed" means in a position appropriate to the person’s vocational intentions, which could be work or further study. Non-vocational placements are not shown.
Placement Information Organized By Program
Master Of Arts (MA) Programs
| Academic Year: | 2011/12 | 2012/13 | 2013/14 | 2014/15 | 2015/16 | 2016/17 |
|---|---|---|---|---|---|---|
| Students Started | 5 | 10 | 5 | 7 | 8 | 9 |
| Current Students* | 0 | 0 | 0 | 0 | 2 | 3 |
| Graduated | 4 | 6 | 4 | 4 | 3 | 4 |
| Changed Program | 1 | 3 | 1 | 1 | 0 | 0 |
| Graduation Rate** | 80% | 60% | 80% | 57% | ||
| Graduation Rate (minus changed program)** | 100% | 86% | 100% | 66% |
* Current Students are those who are still in the program as of September 2018.
** The MA Programs are 2 or 3 year programs. Graduation rates will be updated as students graduate.
Master Of Theological Studies (MTS) Program
| Academic Year: | 2010/11 | 2011/12 | 2012/13 | 2013/14 | 2014/15 | 2015/16 |
|---|---|---|---|---|---|---|
| Students Started | 6 | 4 | 10 | 5 | 13 | 2 |
| Current Students** | 0 | 0 | 0 | 0 | 0 | 1 |
| Graduated | 4 | 3 | 8 | 3 | 10 | 1 |
| Changed Program | 1 | 0 | 0 | 2 | 2 | 0 |
| Graduation Rate** | 67% | 75% | 80% | 60% | 77% | |
| Graduation Rate (minus changed program)** | 80% | 75% | 100% | 100% | 90% |
* Current Students are those who are still in the program as of September 2018.
** The MTS Program is a 2 or 3 year program. Graduation rates will be added as students graduate.
Master Of Divinity (MDiv) Program
| Academic Year: | 2010/11 | 2011/12 | 2012/13 | 2013/14 | 2014/15 | 2015/16 |
|---|---|---|---|---|---|---|
| Students Started | 48 | 36 | 49 | 50 | 35 | 38 |
| Current Students* | 0 | 0 | 0 | 3 | 14 | 22 |
| Graduated | 36 | 26 | 36 | 31 | 13 | 3 |
| Changed Program | 5 | 2 | 7 | 4 | 2 | 3 |
| Graduation Rate** | 75% | 67% | 73% | |||
| Graduation Rate (minus changed program)** | 83% | 71% | 85% |
* Current Students are those who are still in the program as of September 2018.
** The MDiv Program is a 3 or 4 year residential program, and a 5 year distance program. Graduation rates will be updated as students graduate.
Master Of Theology (ThM) Program
| Academic Year: | 2010/11 | 2011/12 | 2012/13 | 2013/14 | 2014/15 | 2015/16 |
|---|---|---|---|---|---|---|
| Students Started | 24 | 34 | 36 | 22 | 29 | 27 |
| Current Students* | 0 | 0 | 1 | 0 | 0 | 1 |
| Graduated | 23 | 26 | 28 | 18 | 26 | 25 |
| Changed Program | 0 | 2 | 0 | 0 | 0 | 1 |
| Graduation Rate** | 96% | 76% | 78% | 81% | 89% | |
| Graduation Rate (minus changed program)** | 96% | 81% | 78% | 81% | 89% |
* Current Students are those who are still in the program as of September 2018.
** The ThM Program is a 1 or 2 year program.
Doctorate Of Philosophy (PhD) Program
| Academic Year: | 2005/06 | 2006/07 | 2007/08 | 2008/09 | 2009/10 | 2010/11 | 2011/12 | 2012/13 |
|---|---|---|---|---|---|---|---|---|
| Students Started | 5 | 4 | 5 | 3 | 5 | 4 | 5 | 3 |
| Current Students | 0 | 0 | 0 | 0 | 0 | 0 | 3 | 1 |
| Graduated | 5 | 4 | 4 | 3 | 2 | 4 | 1 | 2 |
| Changed Program | 0 | 0 | 0 | 0 | 0 | 0 | 1 | 0 |
| Graduation Rate** | 100% | 100% | 80% | 100% | 40% | 75% | ||
| Graduation Rate (minus changed program)** | 100% | 100% | 80% | 100% | 40% | 75% |
* Current Students are those who are still in the program as of September 2018.
** The PhD program is a 4 year program, but students regularly take five or six years. More years will be posted as students graduate.
Visit Calvin Theological Seminary’s Campus
We can’t wait to host you on campus! Schedule your visit today, or, if you need more time to find a date that works for you, please request information so we can continue the conversation about supporting your calling!
